Global Journal of Zoology
Multivariate analysis of cranial measurements of Cameroon’s Blue Duiker (Cephalophusmonticola Thunberg, 1789)
IngFokam Miantsia Olivier1*, Meutchieye Félix1 and PrEvaristus Tsi Angwafo2
2University of Bamenda, Cameroon
Cite this as
Miantsia FO, Meutchieye F, Angwafo T (2020) Multivariate analysis of cranial measurements of Cameroon’s Blue Duiker (Cephalophusmonticola Thunberg, 1789). Glob J Zool 5(1): 016-021. DOI: 10.17352/gjz.000015The blue duiker (Cephalophusmonticola)isexclusively an African wild bovidae. It is a principal source of protein in the African forest zones and contributes in the nutrition of local populations. Fifteen cranial measurements on 60 skulls using the opportunist’s method as from January 2018 to December2018. Descriptive statistic and multivariate analysis were done using SPSS version 21.0software and XLSTAT-Pro version 7.5.2 software. It reveals that, there exist a significant difference between males and females skull (p>0.05): total length of skull 114.32 ± .81 and 121.71 ± 1.77; Palate maximal width 35.24 ± .75 and 44.96 ± 14.80; postorbital apophyses width 23.34 ± 1.11and 36.26 ± 1.79; Palatine length 55.31 ± 1.16 and 66.52 ± 1.86; condyle basal length 96.53 ± 1.26 and 105.43 ± 3.05 for the males and females respectively. We have a high positive correlation between the jugal teeth line length and the total skull length (0.973); between palatine length and the total skull length (0.990) and, between condyle basal length and the total skull length (0.993). The principal component analysis (PCA) enable us to see the level of genetics variabilities of blue duiker through skull measurements. These variables measurement are close together from one to another where there is a high similarity between species. Despite these similarities, the population structure of blue duiker shows three sub-species of blue duiker C1, C2 and C3 found respectively in the agro ecological zones of the Western highlands, Mono-modal humid forest and Bimodal humid forest. These three sub-species varies genetically.
Abbreviations
CBD: Convention on Biological Diversity; FAO: Food and Agricultural Organization; IRAD: Agricultural Research Institute for Development
Introduction
The hunting of wild life species in the tropical humid region was the principal source of protein and the local trade [1,2]. Bush meat represented 80% of the protein contributions in the rural communities of the developing countries. The carcass animal sold in the urban markets are made up of mostly mammals (95.0%), reptiles (4.6%), birds (0.4%) and amphibians [3,4]. Within these carcass, artiodactyl is more represented (49.82%) with 34.04% of blue duikers [5]. These species are one of the most poached animalsin forest zones. Despite their zoology and economic importance, they are alsoknown asmost offorest ruminant. It constitutes the first source of bush meat in Cameroon and is threatened per poaching. This practice does not take care of sustainability and the animal quotas. Many studies on the bleu duikers are seen by their abundance (Nasi and Van Vliet, 2011; Towa and al, 2018), inrelation with the structure of themilieu (Dubost, 1079), their food (Dubost, 1984) and any study on the identification of decomposed carcass leaved in the forest.
Indeed, the trapes are stored in the forest. The hunters cannot visit all because, they are often many of them in the forest. For example, in the forest mountain of Oku, one hunter stored more than 818 trapes per hectares [6]. Around the Dja Biosphere Reserve, we have 1515 trapes. The number of trapes cannot enabled hunters to carry all carcass [7]. This situation let to the abandonment of the animal carcass in the forest. It becomes difficult to identify animal carcass when decomposition begins.Especially the blue duikers, if we have 34.0% in the market, it is possible to leave the same percentage of meat in the forest. Then to identify the rest in the forest, it is preferable to adopt other approaches to identify these species and quantify the number of carcass species abandoned in the forest. For this study, the approach we used was the cranial measurement.
Methodology
Area study
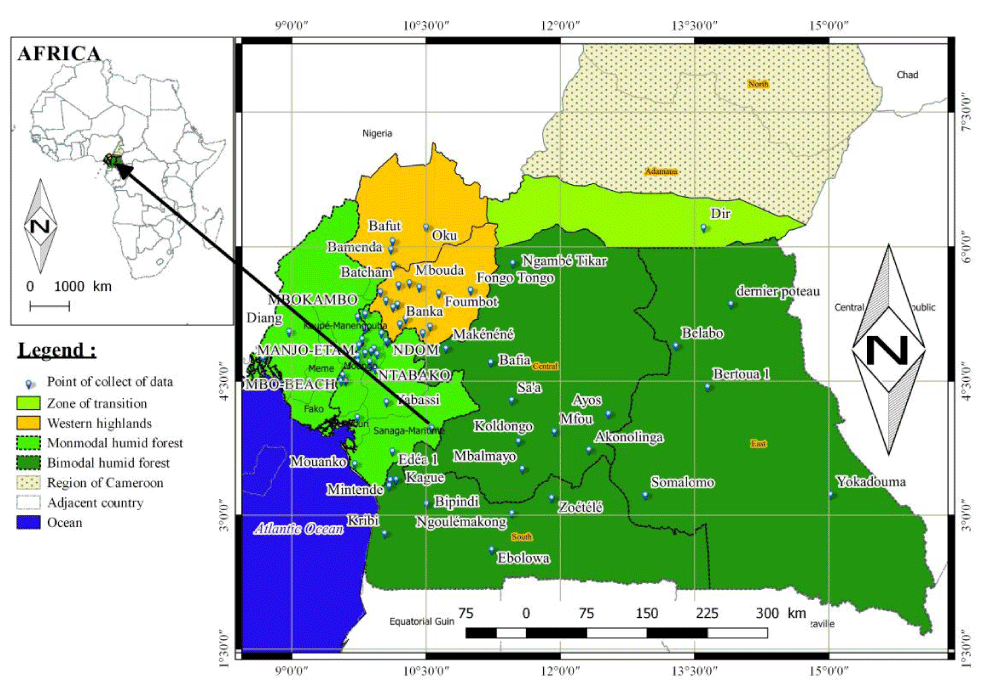
Cameroon is located in the west of CentralSub Region of Africa, stretching from the Gulf of Guinea to Lake Chad. It falls between latitude 2° to 13° Northofthe equator and longitude8° 30’ to 16° 10’East of the Greenwich Meridian. The country covers a surface area of 475,385 Km2 and has a coast line of 402 Km. It is bounded to the South by the Republic ofCongo, Gabon, Equatorial Guineaand the Atlantic Ocean, to the west by the Republic of Nigeria, to the North by Lake Chad and to the East by the Republic of Chad and the Central African Republic.Blue duikersare in three agro ecological zones of Cameroon (Figure 1): western highlands (zone III) falls between latitude 4°54’ to 6°36’ North and longitude 9°18’ to 11°24’ East; monomodal humid forest (zone IV) falls between latitude 2°6’ to 6°12’ North and longitude is 8°48’ to 10¨30’ East and bimodal humid forest (zone V) falls between latitude 10°30’ North to longitude 16°12’ East [8].
Data collections
The cranial measurement uses many existing possibilities (Von Den Driesch, 1976). The measurement numerated from 1 to 10 are the same used by Lajoie, et al. [9] and servedespecially for the classification of sub species of wolf (Canis lupus). Measurements 11; 12; 13; 14 and 16 are the main one to distinguish the Wolf of the Coyote [9]. For instance, ruminants do not have the canine, we have taken 14 measurements. Then, 60 skulls have been measured haphazardly by the opportunistic method developed by Lahm [10], to evaluate the quantity of bush meat in the Central African villages. These 14 measures (in mm) have been taken by the Vernier with the skull mass (in g): total skull length, zygomatic width, jugal teeth, line length, palate maximal width, minimal palate width, post-orbital apophyses width, the height between first molar and orbit, arcade zygomatic height, the fourth upper pre-molar length, second molar width, distance between the margin of the incisives row andthe edge of the temporal condyle, condyle basal length, pre-maxillary width, orbiter angle and mass.
Statistical analysis
On the base of the 14 craniometrical measures, we have used statistical description. The principal component analysis (PCA) have been carried out to evaluate the genetic variability of the blue duiker population studies [11]. The data analysis method called the multivariant analysis, which consist in the transformation of the correlated variable in the new decor relatedvariables from one another. These new variables are named “principal components”, or principal axes. It enablesus to reduce the numbers of variables and to send the least redundant information. The PCA enabledus to identify a least number of components or axes which better explaineddata variability. It consist in compressing the whole number of random variables, the first axes of the PCA are the best choices in terms of the inertia or of the variance.
The construction of phylogenetic tree or dendrogram following the protocol ofHierarchy Ascending Classification (HAC),we haveused the Pearson correlationto identify the genetic type and the relationship which exist between each other [12]. It is one of the statistical method of data analysis which enabled us to divide a whole number of data in different homogenisegroups. In this case, the data of each sub-whole number divides the common measurement, which often correspondsto the proximity criteria (similarities or dissimilarities) that we have defined to introduce the distance measurement and classes between objects. This technique of data analysis also enables us to hierarchy data thereby, to construct dendrograms which gives an evidence of the distance between groups or their similarities and dissimilarities.
Analysis of population structure has been realized by means of Factorial Discriminant Analysis (FDA) on the base of 14 measurements [11] thereby to identify the characters which distinguished better blue duikersas described. It enables to represent graphically the different cranial measurements of blue duikers and the centre of their groups using morediscriminants axes.
The software analysis SPSS version 21.0 and XLSTAT-Pro version 7.5.2. was used for data analysis.
Results
Craniometrics measures of blue duikers
Skulls (N=60) has done the 15 measurements. The tables (1) bellow shows that the mass has the significate difference between zone III and zone IV; between zone IV and zone V. On the other hand, we don’t have significate difference between zone III and zone V. Between the two sex, we don’t have significate difference between male and female mass, zygomatic width. On the other hand, skull length presents significate difference between male and female. The coefficient of variation (CV) shows homogeneity between different characteristic of Table 1 and between male and female.
Table (2) presents that any characteristics don’t have influence of agro ecological zone, then any significate difference. On the other hand, we have significate difference between jugal teeth line length female and male, between palate maximal width female and male and, any significate difference between minimal palate width male and female. The coefficient of variation of palate maximal width female presents heterogeneity of this characteristic between female.
Table (3) bellow shows that the height between first molar and orbit has the significate difference between zone III and zone IV; between zone IV and zone V. On the other hand, we don’t have significate difference between zone III and zone V. Between the two sex, we have significate difference between male and female post-orbital apophyses. On the other hand, height between first molar and orbit and arcade zygomatic height don’t present significate difference between male and female. The coefficient of variation (CV) shows homogeneity for the characteristic post-orbital apophyses, but the heterogeneity for the height between first molar and orbit and arcade zygomatic height.
Table (4) presents that any characteristics don’t have influence of agro ecological zone, then any significate difference. we don’t have any significate difference between Fourth upper pre-molar length female and male, between Second molar width female and male and, between the Distance between the margin of the incisives row and the edge of the temporal condyle male and female.
Table (5) presents that any characteristics don’t have influence of agro ecological zone, then any significate difference. wehave significate difference between Condyle basal length female and male, on the other hand, any significate difference between pre-maxillary widthfemale and male and, between the orbiter angle male and female.
T-Testof cranial measurement of blue duikers
Cranial measurements of blue duikers have enable the means separation usingT-Test of student (Table 6) presents the significate bilateral difference for the characteristic following: Total skull length (b), Jugal teeth line length (d), Palate maximal width (e), Minimal palate width (f), Post-orbital apophyses width (g), Arcade zygomatic height (i), Fourth upper pre-molar length (j), Second molar width (k), Distance between the margin of the incisives row and the edge of the temporal condyle (l), Condyle basal length (m) and Orbiter angle (o).
Principal component analysis (PCA) of cranial measurement of blue duiker’s
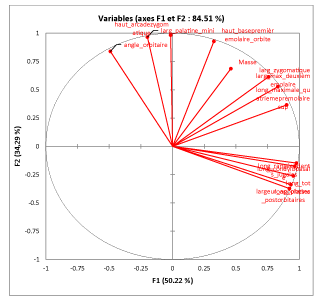
The principal component analysis was done to show the contribution of 15 cranial measurements to the explanation of genetic variabilities within blue duiker’s population. These 15 measurements have enable us to obtain 15 proper values which permitted the construction of correlation circle (Figure 2).
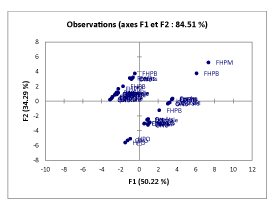
The observation of the figure 2 shows that orbiter angle, arcade zygomatic height and the minimal palate width are the orthogonal ones against others, they are significantly non-correlated. The cranial measurements of blue duikers are mostly closer one against the other, indicating that these measurements construct a similar structure (Figure 3).
The figure 3 enables us to represent cranial measurement on a map of two dimensions, thus to identify tendencies.
Hierarchy ascending classification (HAC) of blue duikers of Cameroon
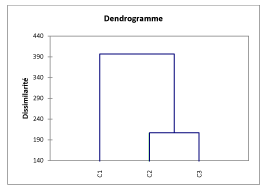
Dendrogram of figure 4 illustrates the link between three genetic types of the populations according to the similarities.
We have noted the similarities between blue duikers of Western agro ecological (C1) and those of the monomodal humid forest (C2). We have also observed similarities between the monomodal humid forest (C2) and the bimodal humid forest (C3). In the contrary, we observed a dissimilarity between blue duikersof Western agro ecological(C1) and those of bimodal humid forest (C3). Then, blue duiker’s populations could have constituted three (3) sub species: C1, C2 and C3.
o Factorial Discriminant analysis (FDA) of blue duiker
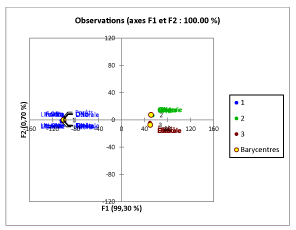
Factorial Discriminant Analysis (FDA) of cranial measurements has also enabled to detect that the population study constitutes of three genetics types (figure 5).
On the figure 5, are clustering cranial measurement on the factorial axes. We observed three barycenter corresponding to the three-sub species C1, C2 and C3.
Discussion
The skull mass of blue duikers in the three agro ecological zones showed little variation, they did not present any influence on the mass. However, the coefficient of variations between these three zones was higher. The knowledge of skull of blue duikers enabled us to easily identify their abandoned carcassin the forest. Then in the frame of the fight for anti-poaching, these results will enable us to determine the quantities of abandoned carcass in the forest by the hunters. According to Decree N° 95/466/PM of 20 July fixingthe modalities of application regime on wildlife in its article 24 (1), traditional hunting is free on all extended territory, except in a private property, in the protected area where it is submitted to the regulation [13]. This disposition is not always respected by the local population of the forest zone which poaches this species. It conducted to the abandoned of animal carcass in the forest and put in place the quota problem [14]. These species are highly poached and occupied the first place in the national market of bush meat [4,15]. If we want to evaluate objectively the level ofblue duikers captured, we must estimate the carcass abandoned in the forest because bush meat of blue duikers is very important for the local population [16].
The three genetic types obtained enabled us to see the population structure of blue duiker’s in the different agro ecological zone. The knowledge of the resource permitteda good control because in its article 17 on the control of genetic resources used, the Nagoya protocol stipulates it, thereby to favour the respect of applicable rules, each part takes the appropriate measures for the control of genetics resources used and increases the transparency concerned, using [17,18]. These measures must be linked with the use of genetic resources with the pertinent collection ofinformation.
Conclusion
The combination of cranial measurement has enable to send out three genetic types which has permitted to see the structure of blue duiker’s populations of Cameroon. As it was observed, between C1 and C2 one part and between C2 and C3 other part, blue duikers of Cameroon are present in sub-species. The similarities observed was due to the transition zones between the different agro ecological zones, while the dissimilarity observed between C1 and C3 was due to the fact that, certain blue duikers are at the extremities of zone II, V and IV. Then craniometrics approach enabled us to implement the Decree N° 95/466/PM of 20 Julywhich fixedthe modalities of application regime of wildlife.
Acknowledgment to: CAREDEPA (Centre African of Research and Development Participative) for funding on this research; the hunters, sellers and Wildlife personnel for their collaborations.
- Wayne M, Gail H, Andrew JB (2009) The market for bushmeat: Colobussatanason Bioko Island. Ecological Economics 68: 2619-2626. Link: https://bit.ly/3h3oogR
- Nougoue AR (2012) DNA Barcoding as a Tool for the Identification of Illegally Traded Wildlife Products. Concordia University Montreal, Quebec, Canada. Thesis of Master of Science (biology). Link: https://bit.ly/2XJwxQ7
- Fargeot C (2005) La chasse commerciale en Afrique centrale, une activité territoriale de rente. Dossier 65, chasse commerciale/le point sur… Bois et Forêts des Tropiques 283 : 65 – 80. Link: https://bit.ly/2AQX5pk
- Fa EJ, Seymour S, Jef D, Amin R, Albrechtsen L, et al. (2006) Getting to grips with the magnitude of exploitation: Bushmeat in the Cross–Sanaga rivers region, Nigeria and Cameroon. Biological Conservation 129: 497– 510. Link: https://bit.ly/2XHQ82R
- Meutchieye F, Miantsia FO, Ngang NM, Angwafo TE, Yacouba M (2012) Bushmeat consumption in Bafia region, Mbam et Inoubou Division: preliminary socio-economic, sanitary and environmental impact appraisal. Biosciences Proccedings 18: 14-17.
- Miantsia FO, Meutcheye F, Ngwa MN, Tsi EA, Manjeli Y (2013) Diversité etconsommationdesratsdanslarégionduMont OkuAUNord-Ouest Cameroun. Interna. Confer. OnAfricanMountains, climate change and sustainable development. Dschang Cameroon, Report 75.
- Yene Y (1998) Programme ECOFAC synthèse des études chasse dans la Reserve de Biosphère du Dja et dans la périphérique. Rapport 50.
- IRAD (2008) Deuxième rapport sur l’état des ressources phytogénétique pour l’alimentation et l’agriculture au Cameroun. 93. Link: https://bit.ly/3cK1qrC
- Lajoie A, Philibert A, Jolicoeur H (2003) Guide de prises de mesures crâniennes pour des fins de taxonomie et d’identification des canidés. Ministère des Ressources naturelles, de la Faune et des Parcs, Direction du développement de la faune. Québec. 34. Link: https://bit.ly/2ATBUTy
- Lahm SA (1993) Utilization of forest resources and local variation of wildlife populations in northeastern Gabon. 213-226. In: Tropical forests, people and food. MAB Series Vol. 13. Hladik C.M., Hladik A., Linares O.F., Pagezy H., Semple A. & Hadley M. (eds). UNESCO. 852.
- FAO (2013) Caractérisation phénotypique des ressources génétiques animales. Directives FAO sur la production et la santé animales 151.
- Roux M, Émérite P, Paul U, Marseille C (2006) Algorithmes de classification. Université Paul Cézanne Marseille, France. 50. Link: https://bit.ly/30jazF4
- MINEF (1995) Décret N° 95/466/PM du 20 juillet 1995 – fixant les modalités d'application du régime de faune 49.
- Miantsia FO, Meutchieye F, Tsi EA, Skilton R, Djikeng A, et al. (2015) Contribution du code barre d’ADN à l’identification de la viande de brousse dans les marches du Cameroun. Bulletin of Animal Health and Production in Africa. African Union Inter-African Bureau for Animal Resources. African Animal Genetics Resources Bulletin, 352.
- Fa EJ, Farfan AM, Marquez LA, Duarte J, Nackoney J, et al. (2013) Mapping hotspots of threatened species traded in bushmeat markets in the Cross–Sanaga Rivers region. Conservation Biology 1-10. Link: https://bit.ly/3f64Ab5
- CBD (2018) Décision adoptée par la conférence des parties à la convention sur la diversité biologique. Gestion durable de la faune sauvage. Quatorzième réunion Charm el-Cheikh, Égypte. Link: https://bit.ly/2Aht8Pk
- CDB (2012) Protocole de Nagoya sur l’accès aux ressources génétiques et le partage juste et équitable des avantages découlant de leur utilisation relative à la convention sur la diversité biologique texte et annexe. Secrétariat de la convention sur la diversité biologique Montréal 25.
- Nsangou N, Huart PL, Marielle Puit A (2004) Dynamique de la filière viande de brousse dans la partie continentale du Rio Muni en Guinée équatoriale. Tropicultura 22: 204-210. Link: https://bit.ly/37g0eLB
Article Alerts
Subscribe to our articles alerts and stay tuned.
 This work is licensed under a Creative Commons Attribution 4.0 International License.

 Save to Mendeley
